echarts 圆环进度条的实现
圆环进度表在实际应用中也是比较常见的需求,但是 echarts 并未直接给出这种图表的实现,不过我们却可以借助其他类型的图表来实现圆环进度表。
通过仪表板实现
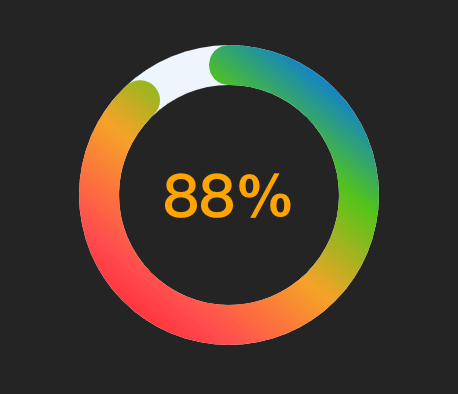
通过指定 startAngle: 90 和 endAngle: -270 即可得到一个圆形的仪表盘,然后再将多余的标签和线隐藏即可,完整示例代码如下:
<script setup lang="ts">
import { onMounted, ref } from "vue";
import * as echarts from "echarts";

const domRef = ref<HTMLDivElement>();

onMounted(() => {
    const options: echarts.EChartsOption = {
        series: [
            {
                type: "gauge",
                min: 0,
                max: 100,
                startAngle: 90,
                endAngle: -270,
                progress: {
                    // 进度值圆圈的样式
                    show: true,
                    roundCap: true,
                    width: 20,
                    itemStyle: {
                        color: new echarts.graphic.LinearGradient(0.8, 0, 0, 1, [
                            { offset: 0, color: "#006EFF" },
                            { offset: 0.25, color: "#52C41A" },
                            { offset: 0.5, color: "#F6A328" },
                            { offset: 0.75, color: "#FF4D4F" },
                            { offset: 1, color: "#FF0F1F" },
                        ]),
                    },
                },
                pointer: { show: false },
                axisLine: {
                    // 背景圆圈的样式
                    show: true,
                    roundCap: false,
                    lineStyle: {
                        color: [
                            [0, "#EEF5FD"],
                            [1, "#EEF5FD"],
                        ],
                        width: 20,
                    },
                },
                axisLabel: { show: false },
                axisTick: { show: false },
                splitLine: { show: false },
                title: { show: false },
                detail: {
                    // 中间百分比文字
                    show: true,
                    color: "orange",
                    offsetCenter: ["0%", "0%"],
                    formatter: (value: Number) => {
                        return value.toFixed(2).replace(/\.0+$/, "") + "%";
                    },
                },
                data: [88],
            },
        ],
    };
    const chart = echarts.init(domRef.value!);
    chart.setOption(options);
});
</script>

<template>
    <div ref="domRef" style="width: 200px; height: 200px; margin: 0 auto"></div>
</template>
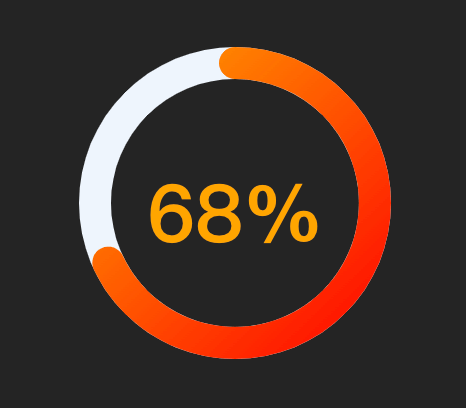
通过极坐标实现
<script setup lang="ts">
import { onMounted, ref } from "vue";
import * as echarts from "echarts";

const domRef = ref<HTMLDivElement>();

onMounted(() => {
    const value = 68; // 0~100
    const options: echarts.EChartsOption = {
        title: {
            text: `${value}%`,
            left: "center",
            top: "40%",
            textStyle: {
                color: "orange",
                fontSize: 40,
                fontWeight: "bold",
            },
        },
        angleAxis: {
            type: "value",
            max: 100,
            // startAngle: 0,
            axisLabel: { show: false },
            axisLine: { show: false },
            splitLine: { show: false },
            axisTick: { show: false },
        },
        radiusAxis: {
            type: "category",
            axisLabel: { show: false },
            axisLine: { show: false },
            splitLine: { show: false },
            axisTick: { show: false },
        },
        polar: { radius: ["60%", "80%"] },
        series: [
            {
                type: "bar",
                data: [100],
                coordinateSystem: "polar",
                stack: "1",
                color: "#EEF5FD",
                emphasis: { disabled: true },
            },
            {
                type: "bar",
                data: [value],
                coordinateSystem: "polar",
                stack: "1",
                color: new echarts.graphic.LinearGradient(0, 0, 1, 1, [
                    { offset: 0, color: "orange" },
                    { offset: 1, color: "red" },
                ]),
                roundCap: true,
            },
        ],
    };
    const chart = echarts.init(domRef.value!);
    chart.setOption(options);
});
</script>

<template>
    <div ref="domRef" style="width: 200px; height: 200px; margin: 0 auto"></div>
</template>
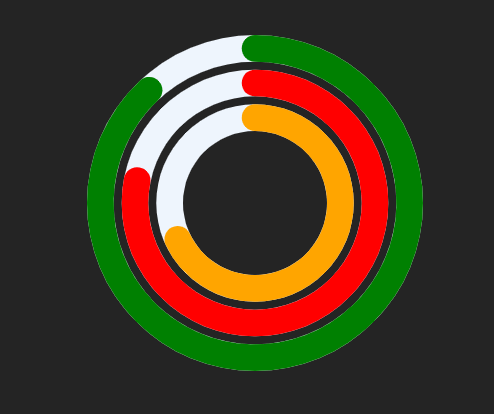
<script setup lang="ts">
import { onMounted, ref } from "vue";
import * as echarts from "echarts";

const domRef = ref<HTMLDivElement>();

onMounted(() => {
    const value = 68; // 0~100
    const options: echarts.EChartsOption = {
        angleAxis: {
            type: "value",
            max: 100,
            axisLabel: { show: false },
            axisLine: { show: false },
            splitLine: { show: false },
            axisTick: { show: false },
        },
        radiusAxis: {
            type: "category",
            axisLabel: { show: false },
            axisLine: { show: false },
            splitLine: { show: false },
            axisTick: { show: false },
        },
        polar: { radius: ["30%", "90%"] },
        series: [
            // 第一组圆环
            {
                type: "bar",
                data: [100],
                coordinateSystem: "polar",
                stack: "1",
                color: "#EEF5FD",
                emphasis: { disabled: true },
            },
            {
                type: "bar",
                data: [value],
                coordinateSystem: "polar",
                stack: "1",
                color: "orange",
                roundCap: true,
            },
            // 第二组圆环
            {
                type: "bar",
                data: [100],
                coordinateSystem: "polar",
                stack: "2",
                color: "#EEF5FD",
                emphasis: { disabled: true },
            },
            {
                type: "bar",
                data: [value + 10],
                coordinateSystem: "polar",
                stack: "2",
                color: "red",
                roundCap: true,
            },
            // 第三组圆环
            {
                type: "bar",
                data: [100],
                coordinateSystem: "polar",
                stack: "3",
                color: "#EEF5FD",
                emphasis: { disabled: true },
            },
            {
                type: "bar",
                data: [value + 20],
                coordinateSystem: "polar",
                stack: "3",
                color: "green",
                roundCap: true,
            },
        ],
    };
    const chart = echarts.init(domRef.value!);
    chart.setOption(options);
});
</script>

<template>
    <div ref="domRef" style="width: 200px; height: 200px; margin: 0 auto"></div>
</template>